Article
Klochkova O.I., Shabanov G.A. Session dynamics of bioelectrical activity of the brain during intellectual computer work (2020). National Psychological Journal, [Natsional’nyy psikhologicheskiy zhurnal], 13(1), 78–93.
Abstract
Background. Registration and analysis of bioelectric activity of the brain while performing the mental task allows us to obtain objective information about the physiological processes of the brain.
The Objective of the paper is to analyse session dynamics of changes in Theta rhythm(4-8 Hz), Delta rhythm (1-3.99 Hz), as well as slow (0.99-0.1 Hz) biorhythms of the human brain by registering the spectrum of the difference function of bioelectric activity (FBA) in the process of positional computer game.
Design. The efficiency of positional computer game of 65 female subjects in the age range of 18-58 years was analyzed. In 7 players in the course of four sessions of the game, the bioelectric activity of the brain in the range from 8 Hz to 0.13 Hz was studied.
Results. It is shown that the difference function of bioelectric activity at the significance level p=0.05 differs for each hemisphere in the frequency range. The changes in the frequencies of excitation (maxima) and inhibition (minima) of the difference function of bioelectric activity of the brain with an increase in the number of game sessions in each hemisphere in the ranges of theta, Delta and slow rhythms are revealed. A psychophysiological model of the player’s operations is proposed, which is consistent with the obtained data. The Statistica 10.0 package was used for statistical analysis.
Conclusion. In the final sessions of the positional computer game, the activity of the left hemisphere is reduced than the right one. As the strategy of the game has already been tested, the main elements of the game are already in memory, the novelty is almost absent. This is consistent with the transition from a successive (step-bystep) method of information processing to a simultaneous (one-step) analysis of the game position, which is characterized by rapid automatism in decision-making and performance.
Accepted: 12/27/2019
Pages: 78-93
DOI: 10.11621/npj.2020.0108
PDF: Download
Keywords: bioelectrical activity of the brain; cognitive processes; biorhythm of the brain; interaction with a computer; positional game;
Available Online 31.03.2020
Table 1. Session samples of the clicks
|
Session N |
Mean clicks NПр |
Median NПр |
Max NПр |
Min NПр |
|
Session 1 |
5.42+1.99 |
6.00 |
7.50 |
1.94 |
|
Session 2 |
4.92+1.71 |
4.61 |
7.72 |
2.89 |
|
Session 3 |
4.89+1.97 |
4.44 |
8.72 |
3.05 |
|
Session 4 |
4.08+1.38 |
4.50 |
5.56 |
2.39 |
Table 2. The beginning of the influence of memory in the process of the positional computer game
|
|
Session 1 |
Session 2 |
Session 3 |
Session 4 |
|
Mean N of the first memory click |
27.86 |
16.48 |
21.14 |
19.86 |
|
Mean time of the beginning in memory change (с) |
7.57 |
4.67 |
5.11 |
5.20 |
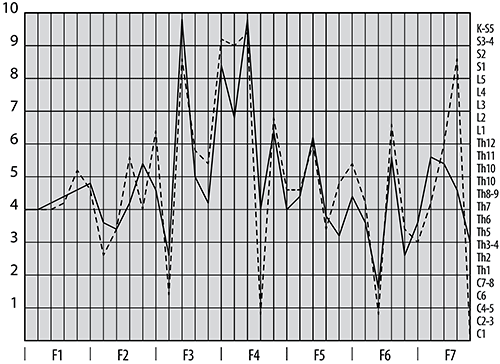
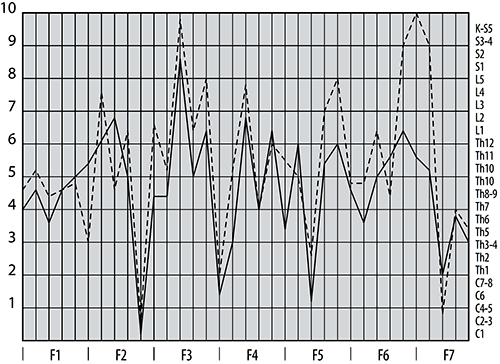
Fig. 1. Graph of the FBA amplitude (bioelectric activity function) values in the theta spectrum frequency range.
NB: the amplitude along the ordinate axis is in relative units, the abscissa shows frequency functions, the solid line is the right hemisphere, and the dotted line is the left hemisphere.
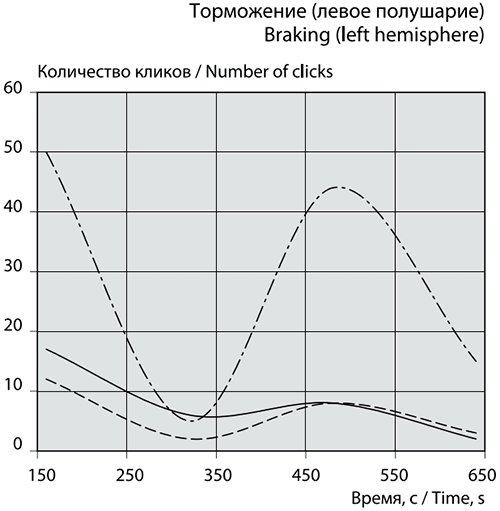
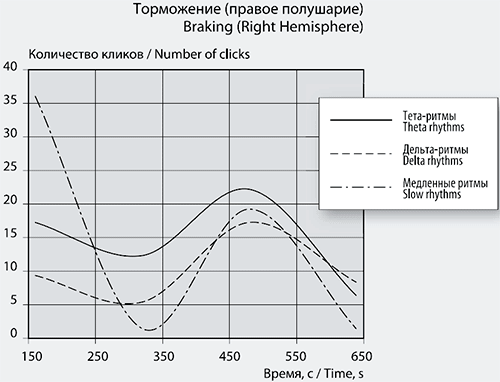
Fig. 2. Time session dynamics of the maxima number (upper row) and minima number (lower row) of the FBA spectral difference.
NB: The results of the left hemisphere are in the left column, the results of the right hemisphere are in the right column. On the abscissa axis, time increments are 160s; on the ordinate axis, there are the number of peaks whose frequencies are in the corresponding range.
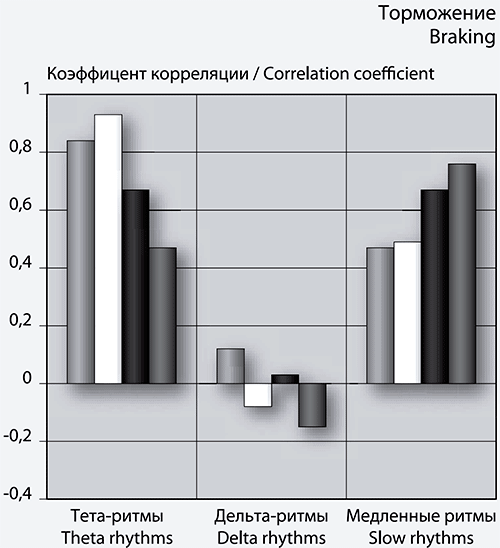
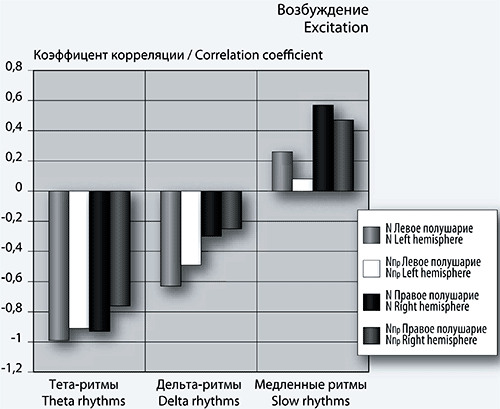
Fig. 3. Bar graphs show the correlation coefficients of the maximums spectrum (left), minimums spectrum (right) and the FBA number of clicks N and NПр.
NB: the X-axis shows the range of spectra, the Y-axis shows the values of the correlation coefficients.
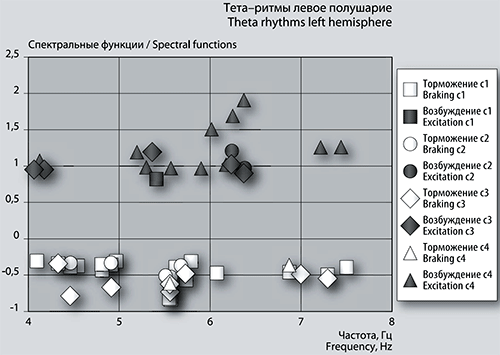
Fig. 4a. Time session schedule of the spectral FBA amplitude dependence on the maximum frequencies in the Theta rhythm range in the left hemisphere.
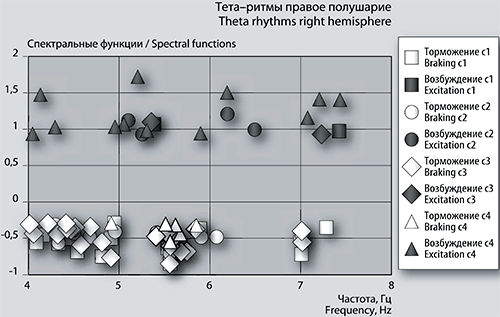
Fig. 4b. Time session schedule of the spectral FBA amplitude dependence on the frequencies of maxima and minima in the range of Theta rhythms in the right hemisphere
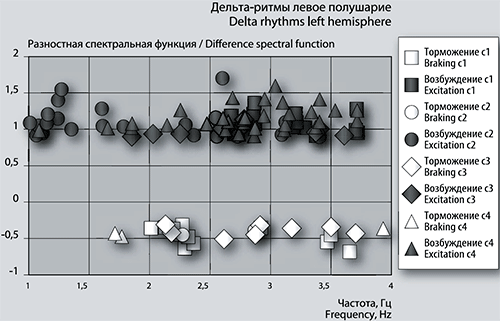
Fig. 5a. Graph of the time session of the spectral FBA amplitude dependence on the frequencies of the maxima in the range of delta rhythms in the left hemisphere.
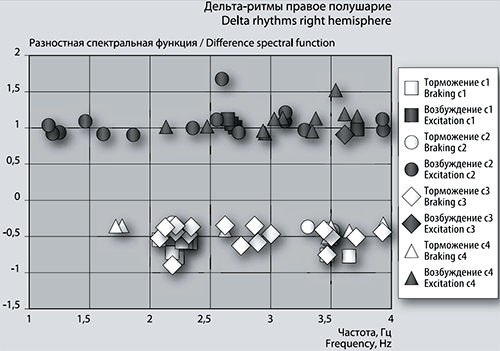
Fig. 5b. Graph of the time session of the spectral FBA amplitude dependence on the frequencies of the maxima in the range of delta rhythms in the right hemisphere.
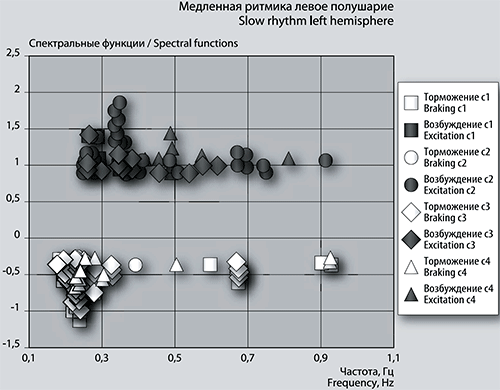
Fig. 6a. Graph of the session (time) dependence of the spectral FBA amplitude on the frequencies of maxima and minima in the range of slow rhythms in the left hemisphere.
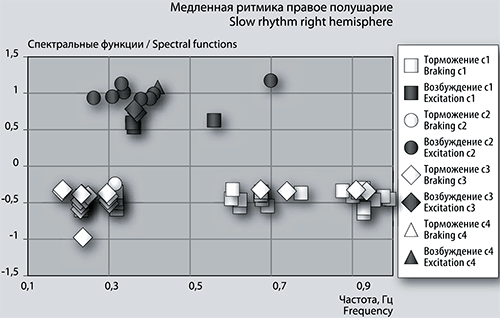
Fig. 6b. Graph of the time session of the spectral FBA amplitude dependence on the frequencies of maxima and minima in the range of slow rhythms in the right hemisphere.
For citing this article:
Klochkova O.I., Shabanov G.A. Session dynamics of bioelectrical activity of the brain during intellectual computer work (2020). National Psychological Journal, [Natsional’nyy psikhologicheskiy zhurnal], 13(1), 78–93.


